Function Plotter f(x)
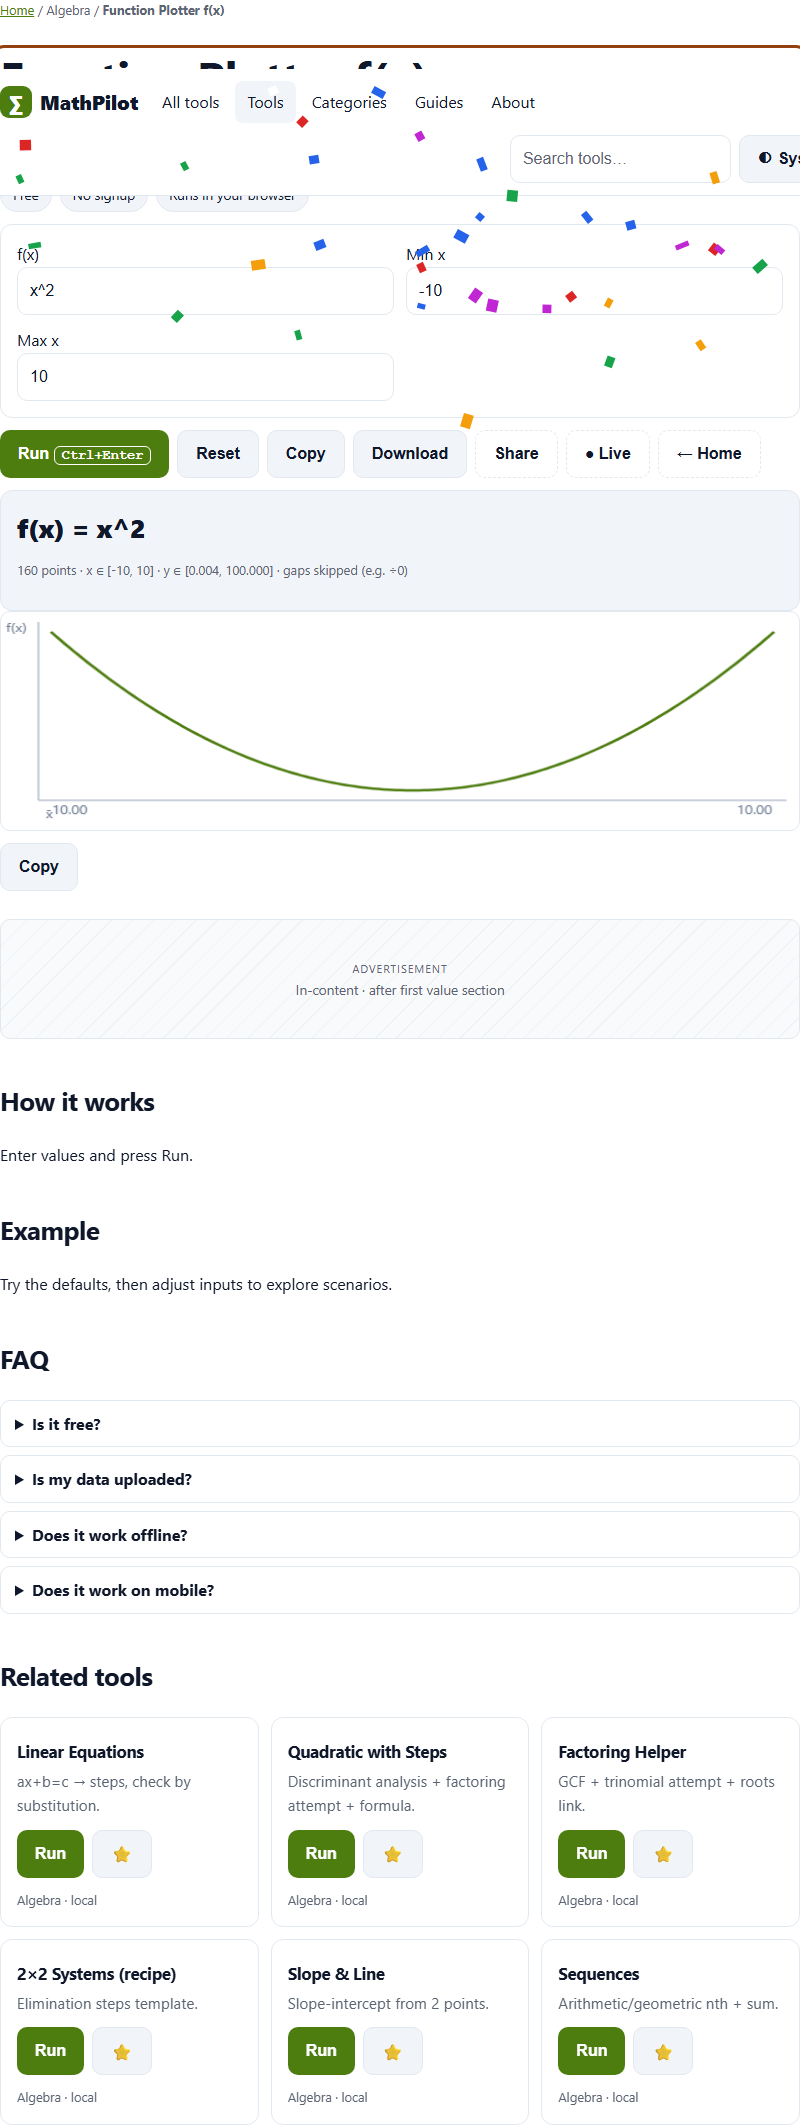
Sample + line chart + range table, gaps skipped.
How to use
Enter f(x), Min x and Max x into Function Plotter f(x) and press Run — or just type, live results update as you edit. MathPilot computes the answer instantly with a pure JavaScript engine (Web Worker for heavy inputs) on this page. Nothing is sent anywhere: no signup, no server round-trip, same inputs always give same outputs.
Steps
- Open the tool below (or scroll to the interactive Function Plotter f(x)).
- Enter f(x), Min x and Max x.
- Press Run (Ctrl+Enter) — or keep typing for live results.
- Copy the answer, download it, or share the link.
FAQ
Is Function Plotter f(x) really free?
Yes — free with no signup, no credits and no limits on this tool. It is supported by clearly labeled ads placed away from the buttons, never by paywalls.
Is anything I type into Function Plotter f(x) sent to a server?
No. Every keystroke is computed with a pure JavaScript engine (Web Worker for heavy inputs) inside this page. Close the tab and your data is gone — unless you explicitly download or share it.
What should I enter in "f(x)"?
Put your f(x) here — for example: x^2. Leave the defaults first to see how it works, then adjust. Every field is validated with a plain-language message if something is off.
I normally use Symbolab — why switch?
If you are tired of step-by-step solutions locked behind accounts and paywalls, MathPilot is the alternative: deterministic Answer, Steps, Explanation — no AI, no account, no credits.
How accurate is Function Plotter f(x)?
Conversions use exact defined factors (like 1 in = 2.54 cm); math tools show deterministic steps you can check by hand.
Content continues below
Free alternative
Free alternative to Symbolab and Desmos for math with steps, from algebra to statistics — deterministic Answer, Steps, Explanation — no AI, no account, no credits. Symbolab vs Desmos vs MathPilot.
Related tools
Content continues below